
Download “FREE EXPERT ADVISOR - ALGORITHMIC TRADING SYSTEM – ADAPTIVE MOVING AVERAGE FOR METATRADER5 DEMO ACCOUNTS”
ALGORITHMICTRADINGSYSTEM20200106-Demo-AMA.zip – Downloaded 1067 times – 94.08 KBDid you know that candles on the chart are just a visual representation of something that the computer has calculated?
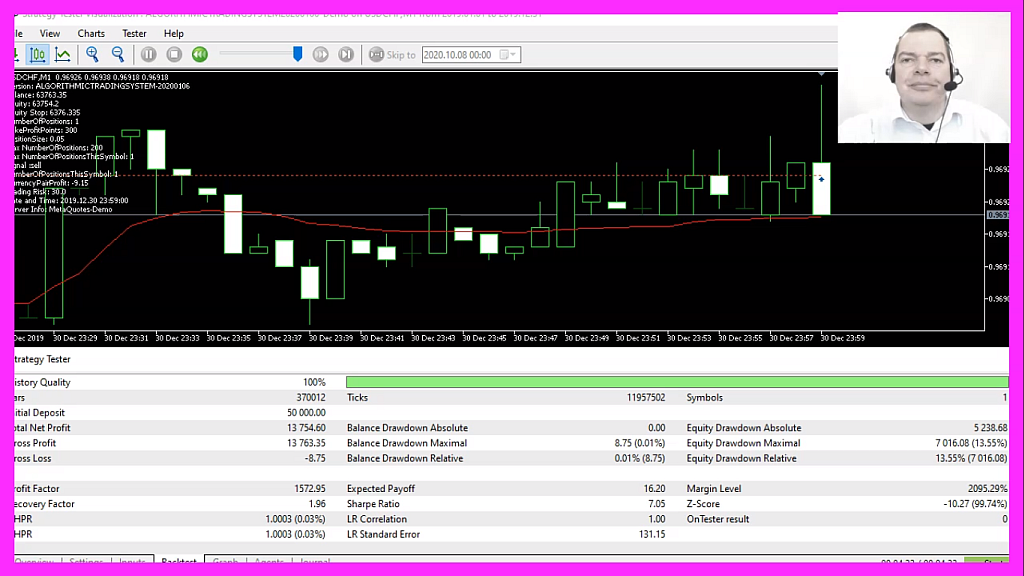
And on top of that, these are even relative representations, so you will only see big candles if they are bigger than the last one and in fact the same candle might look much smaller when you are in volatile times.
Actually you will never know if what you see with your own eyes is something that could be a misrepresentation on your chart.
We all have seen those entry signals and even on the next day we have not been able to find what actually cost us to open a trade the night before.
That is, because we never know if what we see is actually something that might not look totally different in a different context.
Please let me explain what I mean .
If you see something on your chart, it is just a little piece of only available data.
That is like looking through a small keyhole .
You might be able to tell if there is somebody behind the door or if the lights are on.
But just by looking into a keyhole you will never be able to describe the whole room.
So if you really want to make smart decisions based on all the data that is available, you can’t trust just what you see with your own eyes, because you only see a very small part of the reality.

Not sure what to do? Click on the automated trading assistant below

- ALGORITHMIC TRADING ★ PLATIN SYSTEM ★ RANDOM ENTRY ★ RESULTS FOR EURUSD 2012 ✔ You are not losing or wasting time doing the required preparation. Yes, I know how it feels, but don't listen to the dark side.…
- ALGORITHMIC TRADING ★ PLATIN SYSTEM ★ RANDOM ENTRY ★ RESULTS FOR EURUSD 2019 ✔ Testing outages and problems is exactly what demo accounts are for. Some beginners think that demo accounts are a waste of time because they want…
- ALGORITHMIC TRADING ★ PLATIN SYSTEM ★ RANDOM ENTRY ★ RESULTS FOR EURUSD 2018 ✔ There is one overlooked error that causes most trading beginners to lose all their trading capital within six months or less. The worst possible outcome…
- ALGORITHMIC TRADING ★ PLATIN SYSTEM ★ RANDOM ENTRY ★ RESULTS FOR EURUSD 2020 ✔ You can build your system based on two fundamental mathematical laws that are undisputed and proven. With backtesting, you can do a few thousand trades…
- ALGORITHMIC TRADING ★ PLATIN SYSTEM ★ RANDOM ENTRY ★ RESULTS FOR EURUSD 2015 ✔ Trading is like the weather. The fact that the sun is shining in the summer doesn't mean it couldn't rain. Today my results are…
- ALGORITHMIC TRADING ★ PLATIN SYSTEM ★ RANDOM ENTRY ★ RESULTS FOR EURUSD 2016 ✔ Brokers will do what they can to make you trade as much as possible before your expected trading lifespan is over. I think a…
